Over the past few months I have been working on a new website as I have the intention of starting publish more detailed tutorials and continuing with my research once I finish with my university studies.
So far I have managed to build my framework and migrate most of my past projects and some more recent work. Check it out here http://www.wirehouse.co.uk/.
I never forgot my promise to write in details about evolutionary solvers like Galapagos. Although I couldn’t do that in the past, I’ve made significant research on the topic while writing my masters dissertation. If anyone is still interested give it a quick look – From Optimisation to Generation: Evolutionary processes in architectural design. Can’t wait to graduate now and dedicate more time to keep my promise.
As usual, I keep receiving emails with people who need help with the Kartal Pendik Breakdown. If you have any more questions I am always happy to help, but please use the contact form on the new website – Wirehouse Contact Form as this will help me get back to you quicker.
CORE studio is pleased to announce Design Explorer, an open source tool for exploring design spaces on the web. We’ve been working on this project on and off for well over a year now and we’ve presented it a number of times, but we’ve never written about it. Shame on us!
Over the next few weeks, we will publish a series of blog posts about the project’s goals, the natural history of design space tools in AEC, and how Thornton Tomasetti and others are using Design Explorer in practice. This first post will focus on the current state of the project and the main problems that Design Explorer is trying to solve.
The first problem will be familiar to anyone who has done any parametric and/or computational modeling: parametric models give you too many iterations. Of the multitude of possible states that any reasonably complex parametric model describes, which ones are the good ones? Are there some zones that are better than others? If so, how do we find them? It depends what you mean by ‘good’ and ‘better’, of course…
For some design problems, performance is measurable. Designers and engineers can qualify ‘good’ according to project-specific performance criteria. Computational modelers can (and should!) build analysis feedback loops into their models to let performance analysis inform the trajectory of the design process. Since CORE studio supports a world class engineering practice, we have the luxury of dealing almost exclusively with these types of problems. In most cases, we build rich parametric models with embedded analysis feedback loops to rapidly study a wide range of potential solutions. As such, this problem (too many iterations, where are the good ones?) is particularly important to us.
The second set of problems is related to the nature of design spaces themselves. The types of design spaces that our grasshopper definitions and dynamo graphs describe are multi-dimensional. Multi-dimensional spaces work like the three dimensional space we all model in every day – they just have more axes. Whereas a three dimensional point in euclidian space is described like this:a higher dimensional point in a design space might be described like this { length, width, height, numFloors, cornerRadius, rotation, embodiedCarbon, cost }. Because our design spaces are typically of a higher dimension [than three], they are hard to visualize. And because they are hard to visualize, they are hard to navigate.
Wired.com’s illustration of a 3D design space. Source (and excellent article about design space thinking in the graphic design world).
The second set of problems is related to the nature of design spaces themselves. The types of design spaces that our Grasshopper and Dynamo as design space navigation interfaces. Parametric modelers allow you to navigate from one point to another in any design space that you construct. When you drag a slider in Grasshopper, you are moving along a vector in your design space, computing and visualizing one iteration at a time as you go.
Design Explorer is an interface that lets you visualize and filter groups of iterations – sets of design solutions that are both intimately related, and potentially scattered across a vast, high-dimensional possibility space.
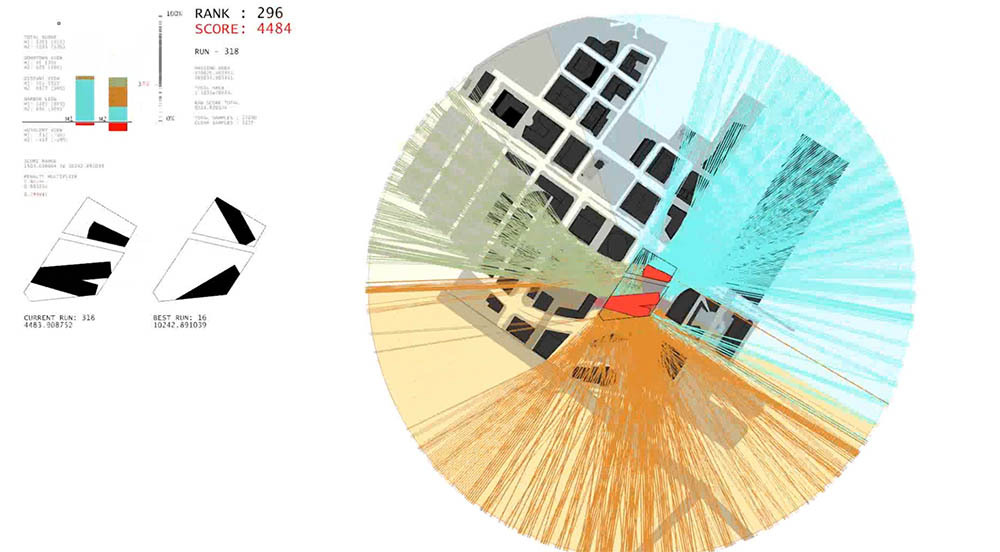
Users export their design spaces from parametric authoring applications (Grasshopper, Dynamo, Catia, Etc.) in the form of a data.csv file and a series of images and Spectacles models. The design space data is generated by traversing the parametric model in an automated fashion – either with our brute force solver, Grasshopper Ladybug’s Fly component, or an optimization algorithm such as Galapagos or Octopus. After all of the data has been generated, it must be hosted somewhere on the web (Google Drive, Amazon S3, or your own server). Design Explorer reads the data.csv file and generates a 2D visualization of the design space called a parallel coordinates plot (with a grid of thumbnails and some other UI). The plot’s vertical axes represent design variables and performance metrics; the lines running horizontally across the plot represent individuals within the design space. The design space can be filtered by clicking and dragging along the vertical axes, and by dragging filters up and down. Users can investigate individuals by clicking on a thumbnail and reviewing a full size image and a 3D model.
Our next post will concentrate on the natural history of these ideas within our group, highlight a few parallel/adjacent projects within the AEC technology community, and identify some meaningful precedents in popular culture. In the meantime, you should try Design Explorer! Give the samples a look, check out Mingbo Peng’s tutorial video, fork the Github report and mess with the code, and let us know what you think!
Cite: Benjamin Howes. “Design Explorer Announcement” Core | Thornton Tomasetti. Accessed 01 Jan 2017.
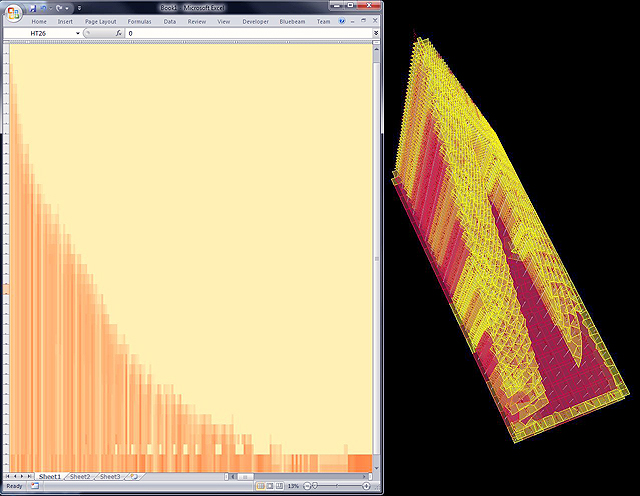
Engineers love Excel. I don’t think anyone will ever be able to count all of the ‘countless’ spreadsheets that engineers at our and other offices have created over the past decades to help speed up repetitive tasks, and to make our lives easier. Many of these spreadsheets work in conjunction with geometry engines such as AutoCAD, or even with other analysis tools.
Here is an example: for every typical structural project, we have to take down column loads to help us determine the size of the structural columns. The typical workflow would be to geometrically assign each portion of a floor of a building to their nearest column, and then to multiply the area of the floor portion with a number of factors for dead loads, live loads and superimposed dead loads. Finally, all of these numbers have to be added up, and from here, the engineer can calculate suitable steel or concrete column sizes that will support those cumulative building loads.
Over the years, we generated a sophisticated spread sheet based column design tool that will help us do the calculation of the column sizes. We also created voronoi meshing scripts for AutoCAD in order to find floor areas for column locations more accurately. These helped us to calculate tributary areas, one floor plan at the time. Then, all that we had to do was to paste the area values into the correct cells in Excel, and the spreadsheet would help us find weight efficient columns.
McNeel’s Grasshopper is a very powerful data mining and data management software that exposes many geometry related operations to the user. So, for the past year, the ACM group has been developing tools for Grasshopper users at Thornton Tomasetti which automate repetitive processes and help engineers generate the data they need. For example, we developed a set of components to calculate column tributary areas of an entire structure at once, and to output the area values into an Excel spreadsheet, so that they can easily be inserted into calculation tools such as the column design spreadsheet described above. Similarly, another component will break down how much of the cumulative façade load is taken per each of the perimeter columns.
While data mining with grasshopper is incredibly powerful, we are also able to take advantage of its generative capabilities; we’ve started to take some of the functionality of the Excel based tools (and other engineering intelligence) straight into Grasshopper. We’ve been calling these tools our Generative Structural Design suite. The first tool that we developed was a column design tool. So now, rather than having to copy and paste values into different cells in Excel, the column sizing code exists right within the Grasshopper interface. As soon as we make a change to, say, the column grid or the building height of the parametric Grasshopper model, the tool will iteratively calculate the smallest possible W-section or square concrete section for each column at each story of the building. It will then graphically render the columns at their locations inside the building, and even output approximate steel and concrete tonnages. The Grasshopper based column design tool is not yet as robust as the spreadsheet based version that we use on most building design projects, but it certainly can be used during the early design stages to generate a good starting point.
We also created components to generate centerlines for girders and infill beams, and to size these based on floor loads. More recently, we developed a tool to design composite beams that take into account the action between slab and steel beam. It also calculates the number of studs required to connect these two elements. Additionally, we created a set of components to help us calculate foundation pile quantities based on cumulative building weight acting upon each of the foundations.
We found that, especially during competition and pre-SD phase, these new tools really help us get a general idea of a building’s performance – if modeled correctly – close to real time. This suite of tools is still work in progress, but at this level, we can comfortably generate truss-free short-span buildings, such as towers, during the conceptual phase in a matter of minutes, rather than days. And, hey, with many competitions coming our way, it proves to be very beneficial to analyze a number of design options for structural efficiencies already leading up to those tight competition deadlines.
Some of these tools even make it all the way past the concept design phases. The tributary area calculators and the centerline creation tools for beams and girders are being utilized on a number of ongoing projects in our offices, and have been saving engineers a lot of time.
But this doesn’t mean that we don’t like Excel anymore! I think it is still the most powerful piece of software ever used in an engineering office. If you like Excel and Grasshopper as much as we do, you should try out our fast Grasshopper-Excel tools from Ben’s earlier blog post!
New year , new competition. It seems a bit late for such saying, but I was working on this entry in December/January and waited only for the results to be published before posting anything. It was a great experience and I can honestly say I was quite happy with the quality of our submission.
We’ve always been a profession of hackers. Every building is a one-off made up of countless elegant hacks, each bringing disparate materials and systems together into a cohesive whole. But when it comes to the software that designers have come to rely on, most of us have been content with enthusiastic consumerism, eagerly awaiting the next releases from software developers like Autodesk, McNeel (Rhino) and Bentley (MicroStation).
It’s been 5 years since we officially launched our research program at the Yazdani Studio of Cannon Design, and during that period we’ve come to understand the evolution of our process reflects the larger, changing relationship architects have with their means of production. Specifically, we’ve noticed that in late 2007 something changed. McNeel introduced a visual programming plugin called Grasshopper, and more and more architects began to hack their tools as well as their buildings.
Courtesy of Yazdani Studios of CannonDesign
With all the buzz around bespoke products and novel technology, it’s easy to forget we still live in an off-the-shelf world. Most things aren’t made-to-order and the software that designers depend on is no different. The program a Hollywood studio is using to create special effects is often the same one an architect uses to study a design idea. It makes sense for software companies to invest in developing tools that serve large market sectors. It also makes sense for small businesses to borrow tools from larger industries. But what about all those little process idiosyncrasies that make design studios unique? Chances are a general-purpose, cross-industry application isn’t going to be 100 percent compatible with the way you do things.
Courtesy of Yazdani Studios of CannonDesign
Since the introduction of AutoCAD in the early 80s, architects have struggled to find a comfortable way to take advantage of efficiencies promised by digital production tools without sacrificing their signature moves. In the 90s, Frank Gehry famously adapted CATIA – software that was originally developed for designing fighter jets – to enable the construction of the complex geometries the firm was trying to create. The result, Digital Project, was developed and supported by off-shoot technology company Gehry Tech. For the rest of the industry, maintaining a team of dedicated programmers, or even retaining architects that became skilled at programming, has proven difficult. Most often, artists and architects have had to choose a compromise between their design process and the functionality offered by the software available on the market. However. a new generation of visual programming tools is now giving designers an alternative: the ability to tailor their applications to the specific way they work – without the team of dedicated programming wizards.
Visual programming is part of a larger classification of tools that support end-user development (EUD). EUD is the developers’ answer to the need for user customization and automation. Most popular software packages ship with a way to modify or even create functionality, and to automate repetitive tasks. Rhino has RhinoScript, Revit has DesignScript, 3dsMax has MAXscript, and Maya has MEL, just to name a few. In reality, there are only a relatively small group of actual end-users that can use these scripting languages with any proficiency, and the few that can, quickly become specialized. Fortunately, an ever expanding roster of visual programming software like Grasshopper,Dynamo, Generative Components, 3dsMax’s MCG, and Marionette for Vectorworks are giving designers access to EUD without any prior knowledge of a programming language. By removing this barrier to entry, visual programming is quickly making EUD in architecture an every-project occurrence.
Courtesy of Yazdani Studios of CannonDesign
The popularity of software like Grasshopper and Dynamo suggests the relationship architects have with their tools is changing. We’re moving away from passive adoption of off-the-shelf software to actively engaging in hacking these tools to better fit our design process. Can’t find a program that does what you want? Make your own. It’s a practice that has the potential to counter the industry-wide homogenization that has left many artists and designers skeptical of the benefits of design software.
There’s more to the rise of visual scripting than just customization; generative design has the potential to allow for non-linearity in production. For architects, that could mean a fundamental transformation in how we do our work. Traditionally, architectural services are delivered along a strict set of milestones. Once a phase is complete, the decisions made in that phase are cemented, and the next phase of development can begin. This process was devised in a pre-digital world and most likely implemented to protect architects from extensive re-work without the ability to charge additional fees. But what if schematic level information could be incorporated into a model late in the development process without costing the designer time or money? What if a piece of new information or a design decision could be incorporated at any point in the process? What if construction documentation could start before schematic design was complete? If an entire project is defined as a series of interconnected decisions and relationships, all of this becomes possible. In fact, it started happening the moment the industry moved away from the hand drafting mimicry of CAD software to the three-dimensional modeling approach thatBIM takes. The next logical step is to abstract away the explicit placement of 3D elements in space, and define a design as a series of decisions, systems, and relationships. In the end, it’s all data, and visual scripting gives designers a way to create and manage it.
It’s exciting to see how the adoption of EUD tools will impact our industry. CAD and BIMwere supposed to revolutionize the practice of architecture. Looking back, it’s difficult to argue that either has been anything more than an incremental step. Will EUD finally deliver the revolution we’ve all been waiting for?
Courtesy of Yazdani Studios of CannonDesign
Yan Krymsky is a Senior Designer for the Yazdani Studio of CannonDesign focused on providing cutting edge design and visualization services to clients. His work has been credited with awards and media accolades and Krymsky continues to focus on new ways for technology to improve the profession.
After getting an Arduino Starter Kit less than a month ago and going through some basic projects I was finally able to go back to an old project with some fresh ideas. The idea of responsive shading isn’t the most original, but I was interested more into learning how to create one before coming up with new theoretical mind blowing solutions. For more go to Responsive shading (A).